
Poplar root spread compared to tōtara and kānuka
Blog post.
Tom Mackay-Smith and Raphael Spiekermann
1/13/20262 min read
Root tensile strength results
Before Christmas we shared our findings from pullout tests on tōtara, poplar –Euramericana hybrid (P. deltoides x nigra), and kānuka across two Yellow Ultic soil types.
Across both soils, kānuka roots were 45–170% stronger than poplar or tōtara.
This month, we will present our field results on root distribution.
Root distribution results
To measure root distribution, we dug two trenches around two individuals of each species at each soil type (12 trees total) to measure root distribution.
All roots were counted at four distances from the trunk (1.5, 2.5, 3.5, 4.5 m) and to 1.05 m depth.
This has been the first study to compare the root distribution of mature natives with poplar on a hill country farm.
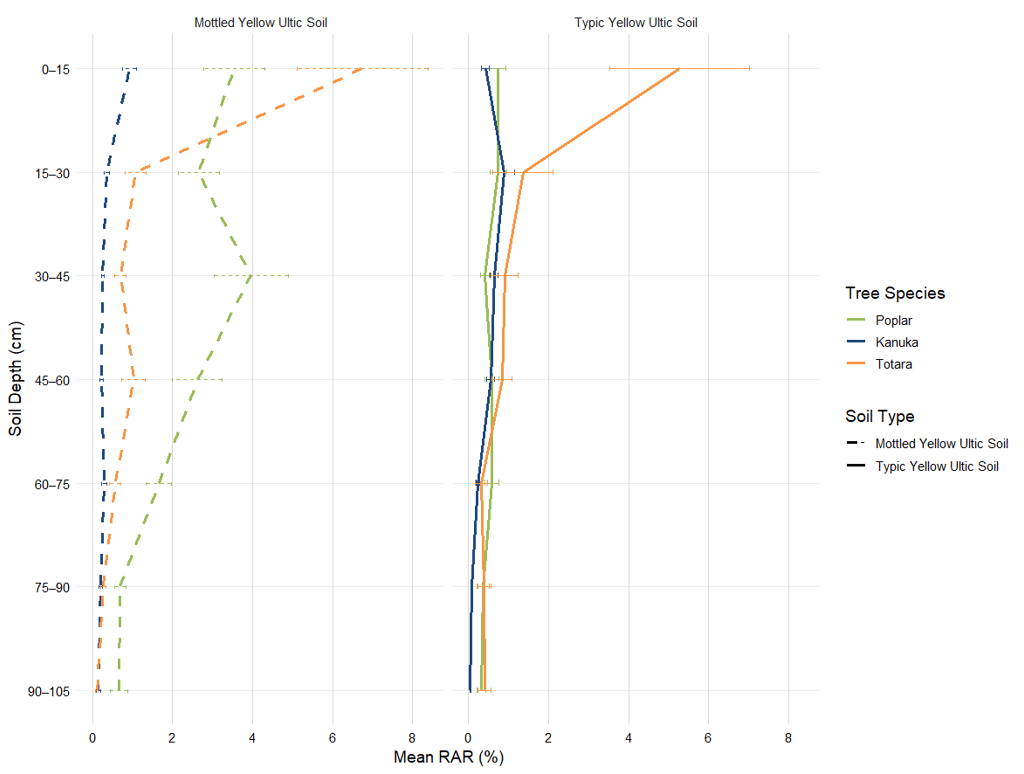
RAR or Root Area Ratio is the total % area of the soil the roots occupy
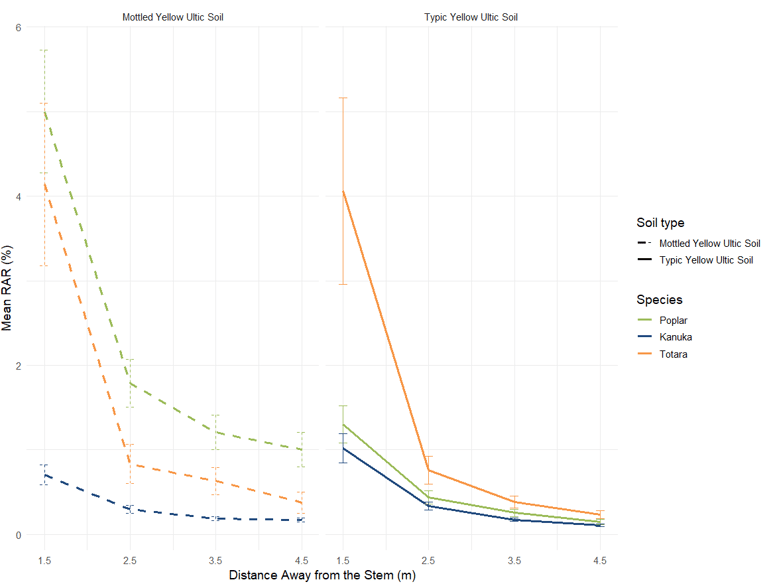
Kānuka and tōtara had similar root distribution trends between sites.
Poplar had the greatest root distribution at both depth and distance on the Mottled Yellow Ultic site, but a smaller distribution than tōtara at the Typic Yellow Ultic sites
Despite being of a similar age and same variety, the poplar trees at the Mottled Yellow Ultic site were substantially larger (av. height 19.6 m; av. DBH 0.90 m) than those at the Typic site (av. height 14.8 m; av. DBH 0.7 m).
These early results suggest site factors influence whether native species can match or exceed poplar root distribution.
The next steps are to combine the root tensile strength and root distribution data to calcualte total root reinforcement for each species, working with Prof. Schwarz (University of Bern) and Dr. Feiko van Zadelhoff.
We will then integrate this data into the SlideForMap model to estimate the effect of each species on slope stability at various densities.
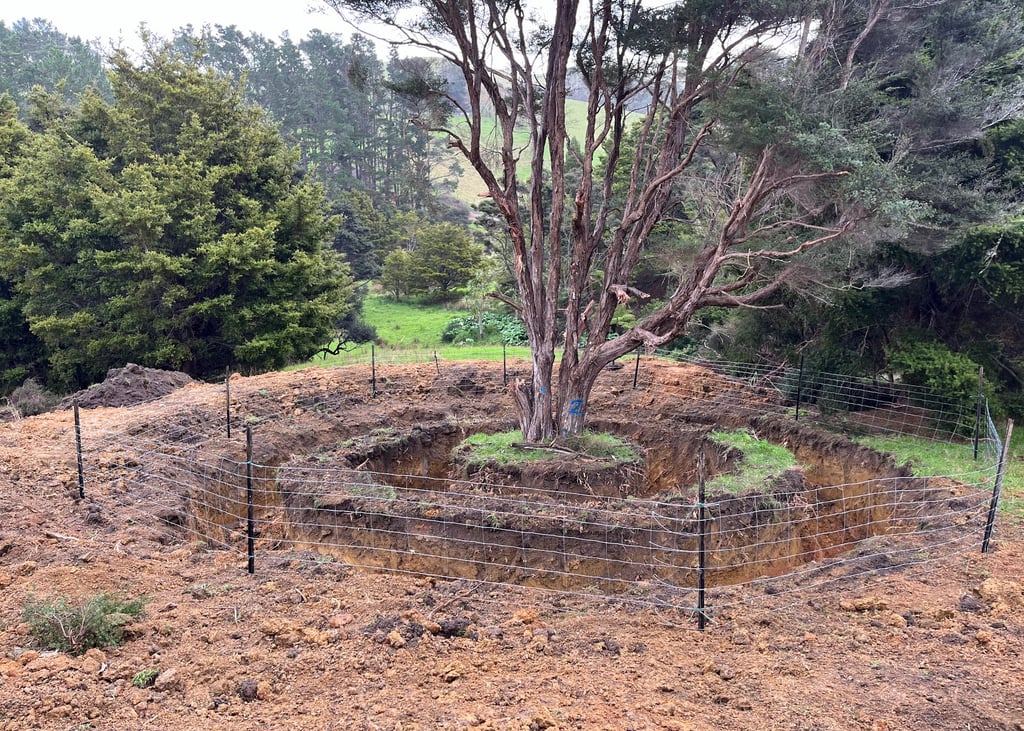
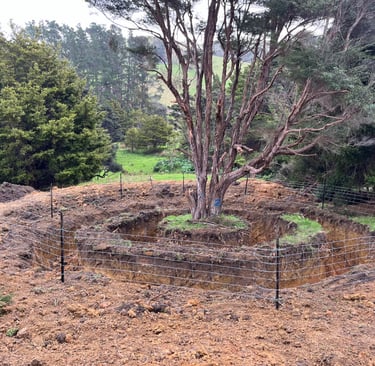
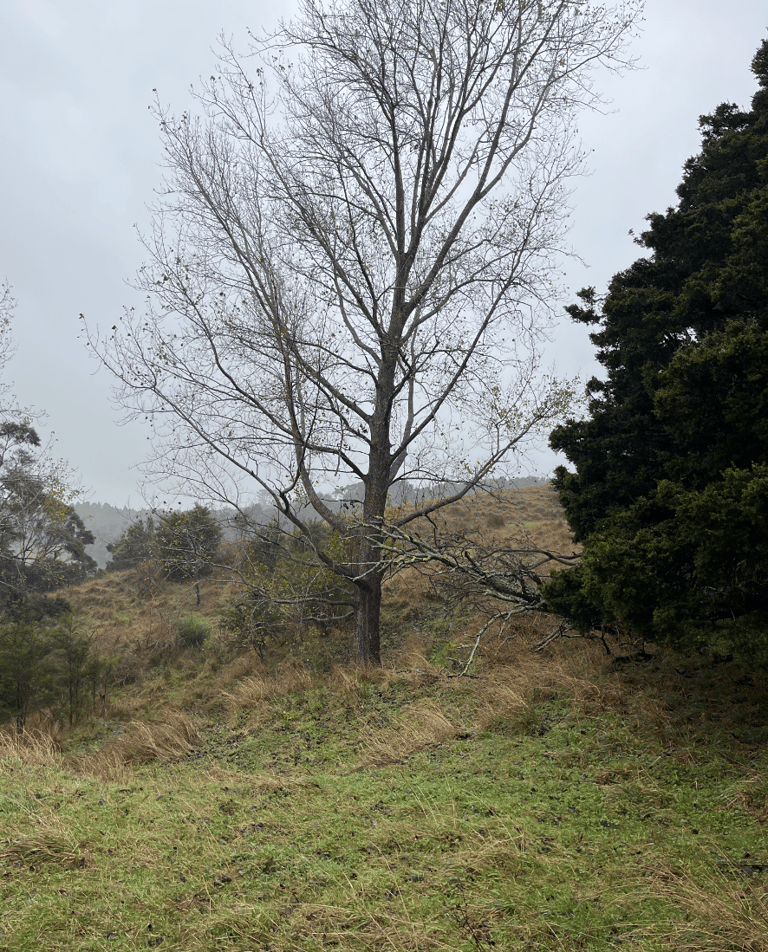
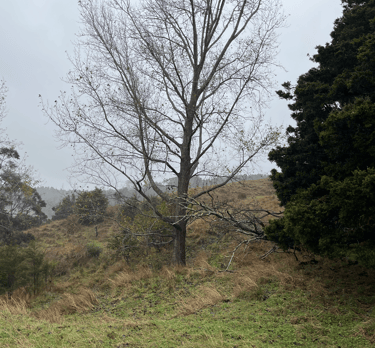
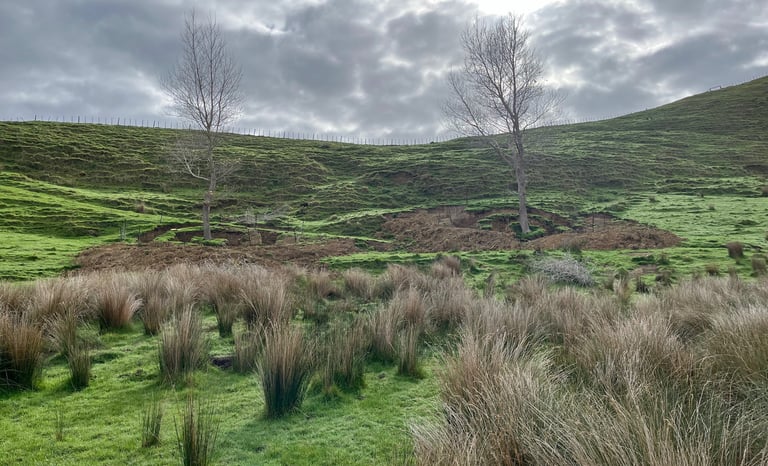
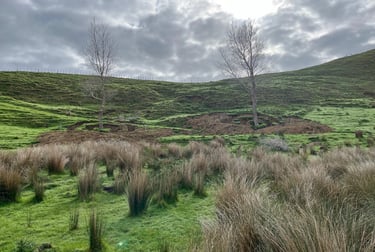
Photos of the month
Below shows the poplar trees that were studied to produce the data above. The top one is one of the large poplar individuals. The lower photo is the two smaller poplars.
Results: Root distribution with depth
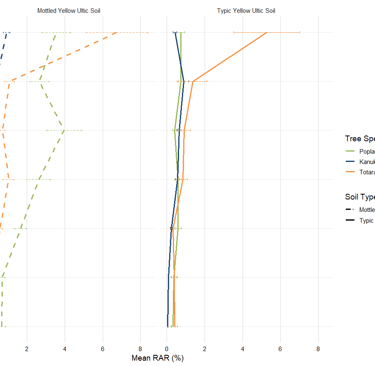
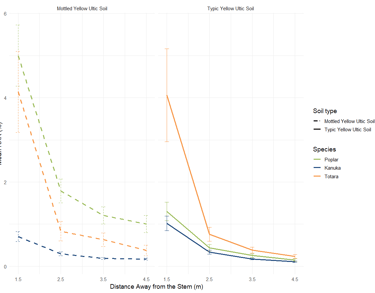
Results: Root distribution with distance
A big thank you to Anne Fokker, one of the Master’s students from Austria working on the project, for creating the graphs.